Monitoring the health of your Exchange server helps you detect any failures or irregularities that might disrupt the normal functioning of your organization. It is crucial that you analyze the performance, security and operations related to the server components to mitigate any impending threats. With Lepide Data Security Platform, you can seamlessly monitor the health of all critical elements of your server. In this article, we will have a look at two ways in which you can monitoring the health of Exchange Server; through native auditing and through Lepide Data Security Platform.
Steps to Monitor Exchange Server Health with Native Method
Step 1. Monitor Server Availability and the Status of Exchange Services
Run the following command in the Exchange Management shell to see if all the services are running:
Test-ServicehealthThe result will look as the screenshot given below:
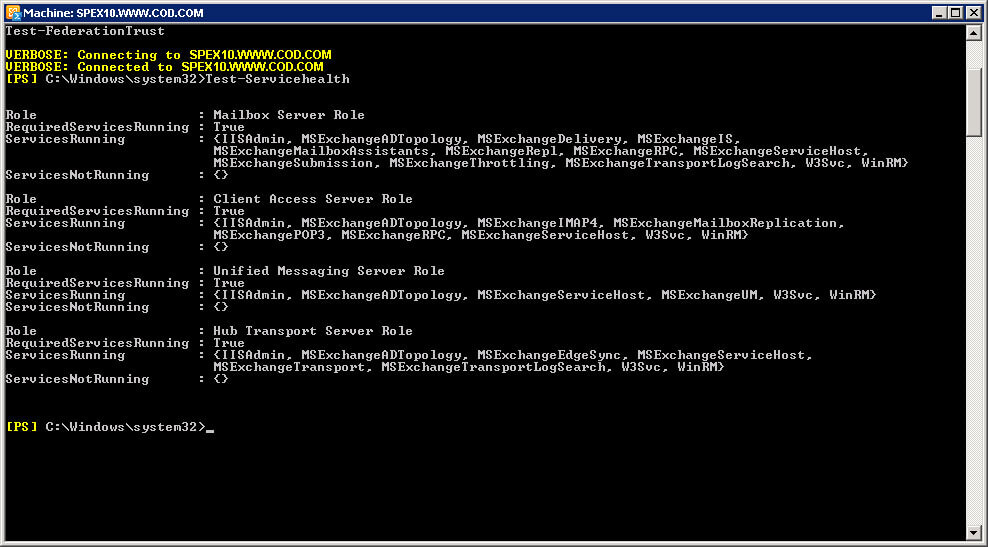
You will have to extract the required details from this window to conclude the status of various services. Not exactly a user friendly way to do it, but it gets the job done.
Step 2. Monitor SMTP performance, CPU and Memory usage on an Exchange Server
Regularly reviewing and monitoring the SMTP logs and queues helps prevent issues related to messaging failures, as all the emails in the Exchange server are transported through these queues.
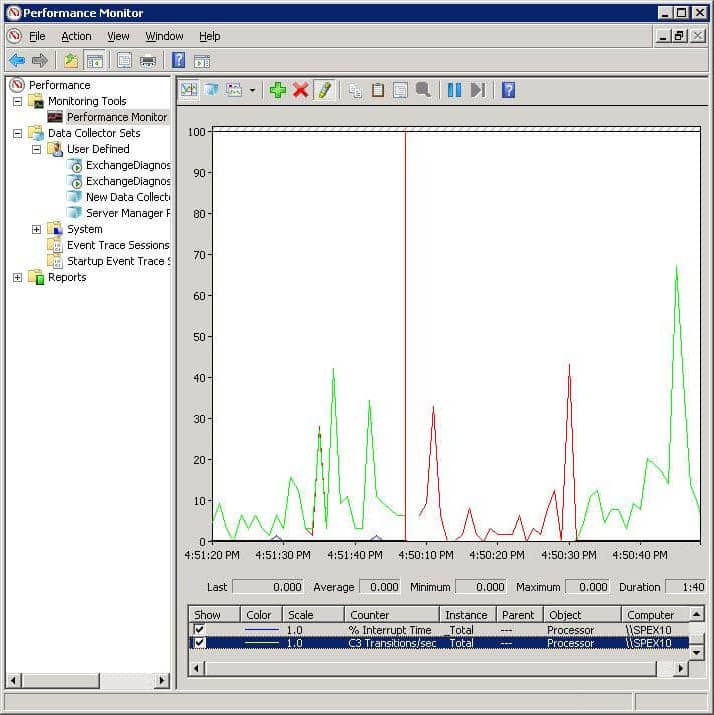
When utilization of CPU and memory exceeds an absolute limit, it could result in slow logons and email flow issues on the server. All these events can be monitored natively using the “Performance Monitor”, which provides a graphical representation of all the data. Let us have a look at the steps to access this inbuilt tool:
- Type the following command at the “Command” prompt or in “Run” box to access the “Performance Monitor”.
perfmon - Right-click details pane and click “Add Counters”.
- Click “Select counters from computer” to monitor a specific computer. You can click “Use local computer counters” to monitor the computer on which the console is running.
- Now click “SMTP server” or any other object from the list that you would like to monitor and click “Add”.
- Click “Ok”.
With hundreds of counters to choose from, admins must have an understanding of what each counter analyzes and measures. Moreover, deriving valid information from this graph is quite complicated as so much data is displayed at the same time with extraneous visual information.
Following is a screenshot of the data generated using this tool:
Step 3. Track the Message Queue
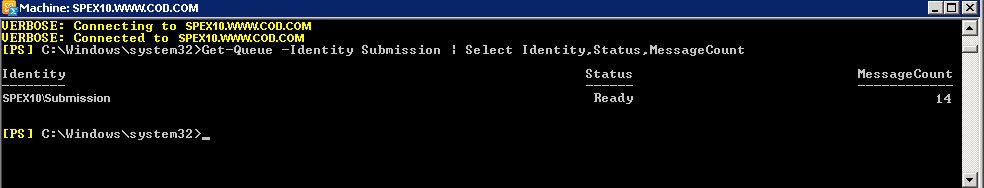
Run the following PowerShell cmdlet in the Exchange Management Shell on your Exchange 2016/2013/2010 to get:
Get-Queue -Identity Submission | Select Identity,Status,MessageCountIn the screenshot that follows, the submission queue shows 14 messages waiting to be processed
You can also use the Queue Viewer which is a part of the Exchange Toolbox to derive details on queues and messages in queues. Take a look at the steps to be followed to use Queue Viewer:
- Go to “Start” ➔ “All Programs” ➔ “Exchange Server 2013” ➔ “Exchange Toolbox”.
- To open the tool, double-click “Queue Viewer” In the “Mail flow tools” section.
- Select “Messages” tab to view those messages that are queued for delivery. You get details like from address, status values of the messages, size, Queue ID and much more.
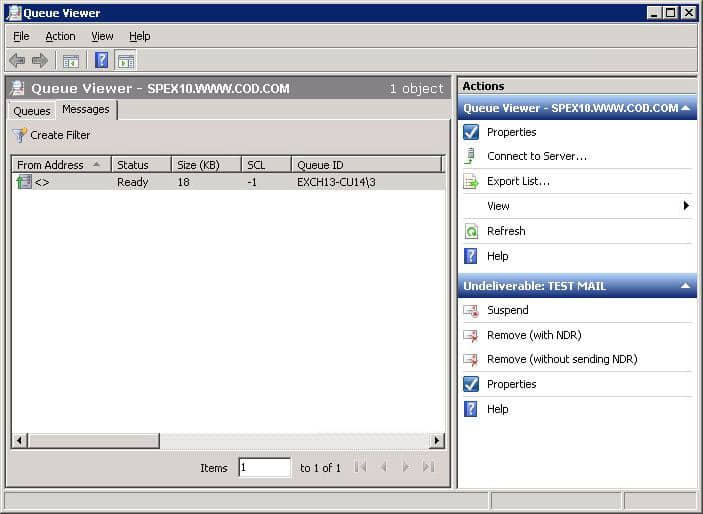
Figure : Queue Viewer to view status of message queues
Issues with Native Auditing
Native auditing methods do not provide granular information like date and time of submission details. Relying on the native mechanisms to gain visibility into events and actions taking place in the Exchange server is not practical, owing to the complexities involved.
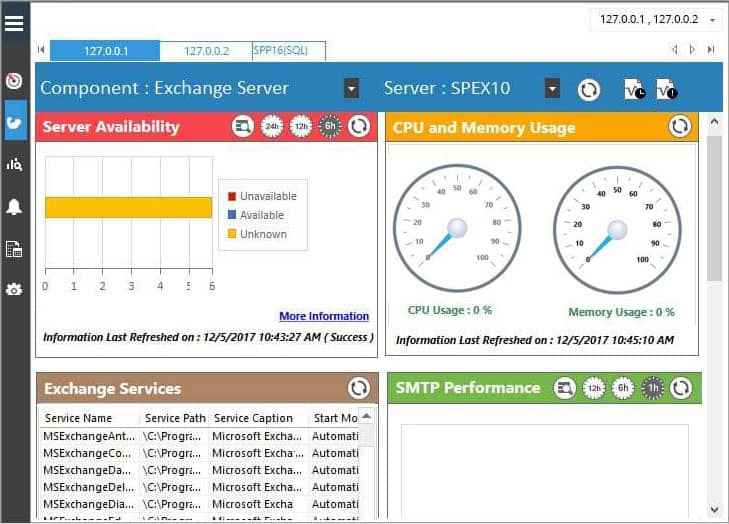
Monitor Exchange Server Health with Lepide Server Health Check
Exchange Server Health Check is an integrated feature of Lepide Data Security Platform designed to help you spot the incongruities in the performance of the server components at a glance. The visually appealing graphical reports offered by our cutting-edge auditing solution simplifies the entire process of performance monitoring.
The solution sends alerts based on these health monitoring reports to keep you informed about the server availability, status of critical services and resource usage, as seen below:
Lepide Exchange Server Auditor help you gain unmatched levels of granular auditing details of configuration changes made to mailbox databases, Exchange policies, storage groups, permissions and much more.