Active Directory health refers to the overall operational status of your AD environment, including replication integrity, service availability, DNS functionality, and security configurations.
It is essential to ensure that you continuously monitor the health of all your critical IT systems. Doing this will help you prevent system downtime and mitigate the damage associated with workplace server disruptions.
Monitoring the health of the Active Directory environment ensures that AD performance is optimized, and any errors are identified and fixed as soon as possible.
Four Native Methods to Check AD Health:
- PowerShell service status check – Verify critical AD services are running
- Repadmin – Monitor domain controller replication status
- DCDiag – Run diagnostic tests on domain controllers
- Event Viewer – Detect security issues like unsecure LDAP binds
In this article, we will look at how to check AD health using native methods and then a more straightforward way to do this using the Lepide Data Security Platform dashboard.
Checking the Health of Active Directory Natively
1. Ensure that the domain controllers are in sync and that replication is ongoing
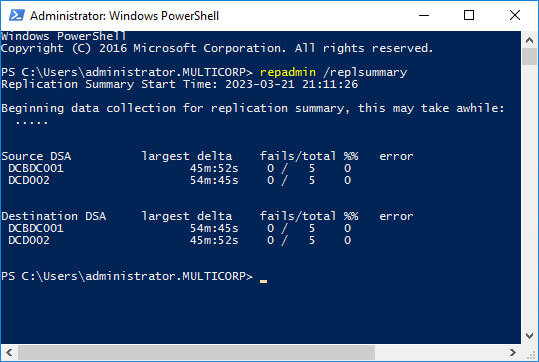
The command Repadmin /replsummary summarizes the replication status of all the domain controllers in all domains in the forest. You will also get to know the last time a Domain Controller was replicated, and why it stopped replicating.
Here is an example output using the repadmin /replsummary command:
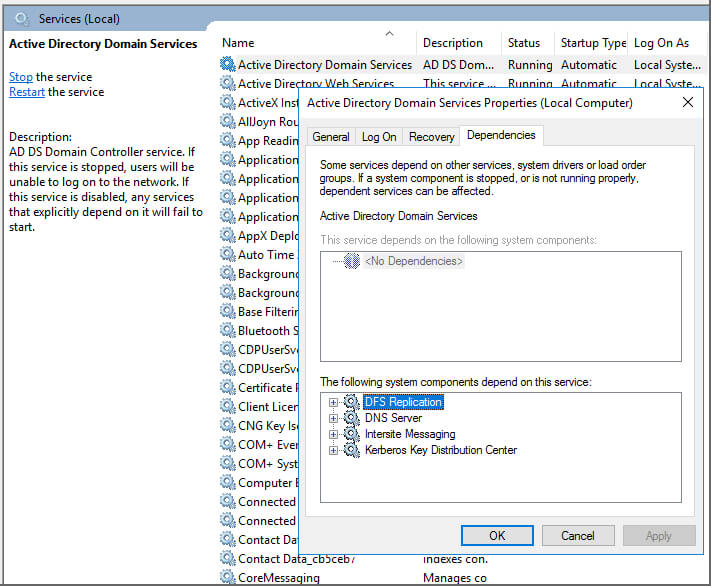
2. Make sure that all the dependency services are running properly
Four system components that are essential for the efficient running of Active Directory Domain Services are:
- DFS Replication
- DNS Server
- Intersite Messaging
- Kerberos Key Distribution Center
These are shown in the screenshot below:
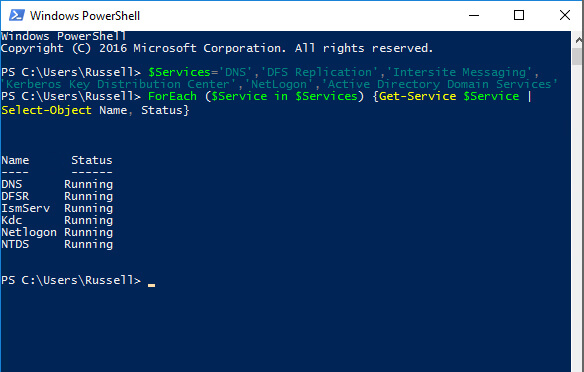
Make sure that these components are running properly by executing the following command:
$Services='DNS','DFS Replication','Intersite Messaging','Kerberos Key Distribution Center','NetLogon',’Active Directory Domain Services’ForEach ($Service in $Services) {Get-Service $Service | Select-Object Name, Status}An example output after executing this command is shown below. Please note that here we’re also checking the health of the NetLogon service, and Active Directory Domain Services (NTDS) as a whole. The example status here shows that all services are running.
3. Use the Domain Controller Diagnostic tool (DCDiag) to check various aspects of a domain controller.
The DCDiag tool can be used by IT administrators to test several aspects of a domain controller including DNS. One of the most common reasons for the non-performance of Active Directory is DNS. DNS failure can in turn lead to replication failure. Executing DCDiag for DNS will enable IT administrators to check the health of DNS forwarders, DNS delegation, and DNS record registration.
The command to run this:
DCDiag /Test:DNS /e /v
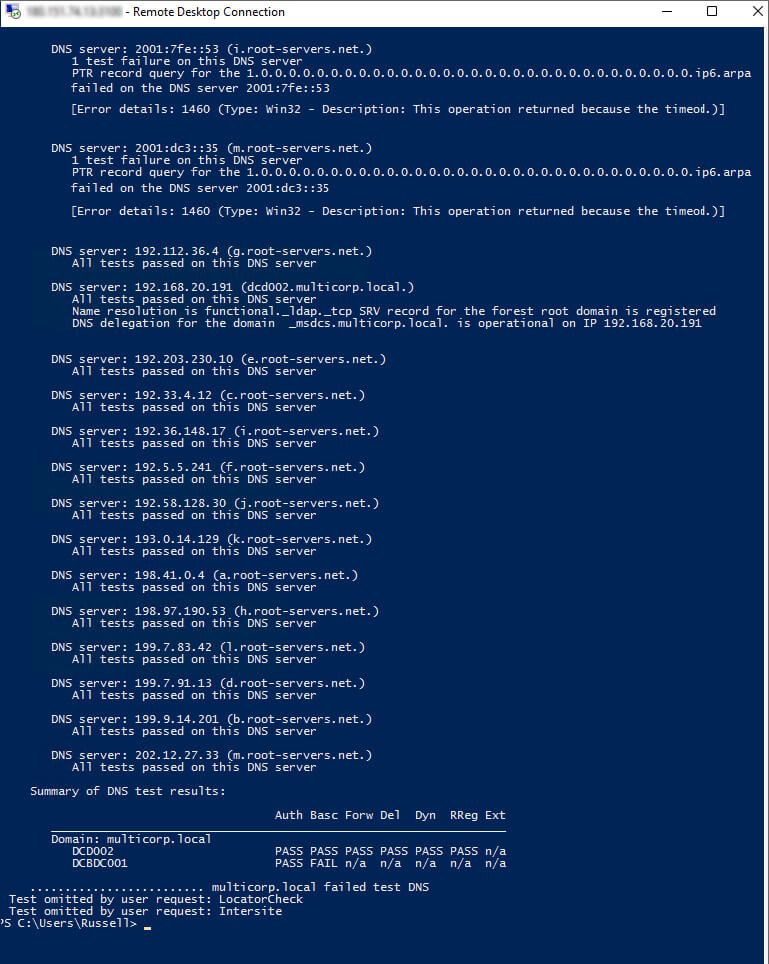
In this sample output, there are no unsecure binds
4. Detect unsecured LDAP binds.
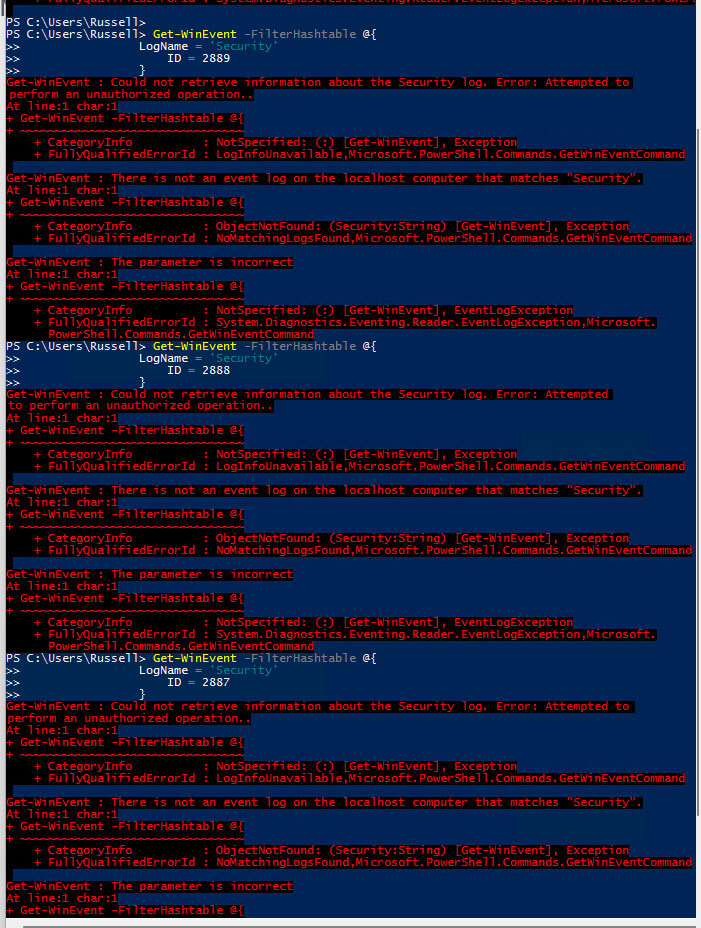
The first step towards reducing the vulnerability of unsecured LDAP binds is to identify whether you are affected, which you can do by looking through Event ID 2887. Event 2887 is logged by default in the Domain Controller once every 24 hours, and it shows the number of unsigned and cleartext binds to the Domain Controller. Any number greater than zero indicates your Domain Controller is allowing unsecured LDAP binds.
Next, you need to detect all devices and applications using unsecured binds by looking through Event ID 2889. Event 2889 is logged in the Domain Controller each time a client computer attempts an unsigned LDAP bind. It displays the IP address and account name of the computer that attempted to authenticate over an unsigned LDAP bind.
The PowerShell cmdlet for getting this is as follows:
Get-WinEvent -FilterHashtable @{
                LogName = 'Security'
                    ID = 2889
                }
Example output:
Checking the Health of Active Directory with the Lepide Data Security Platform
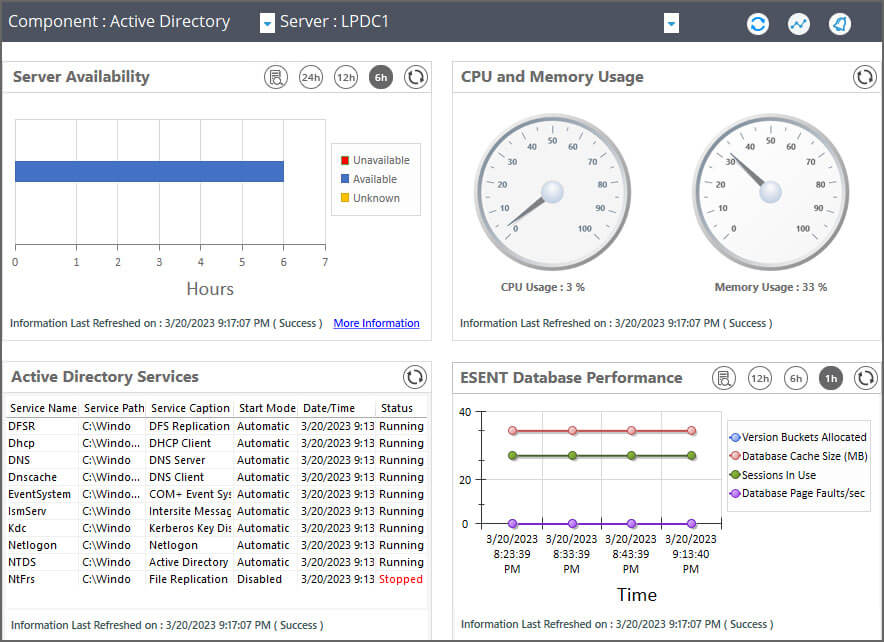
An alternative, more straightforward method of checking Active Directory health is to use the Health Monitoring dashboard within the Lepide Data Security Platform.
The Active Directory Health Check is an integrated feature of the Lepide Solution. It provides a simple and powerful means of keeping track of important elements of your Active Directory to ensure the continuity and health of the AD environment. It provides continuous monitoring and real-time alerts for NT Directory services, DNS Servers, Disk space, CPU, and memory along with service and replication activity.
To display the Lepide dashboard, click the Health Monitoring icon.
The twelve elements which are monitored on the Health Monitoring dashboard are:
- Server Availability – Monitors whether domain controllers are online and responsive
- CPU and Memory Usage – Tracks resource utilization on AD servers
- Active Directory Services – Verifies core AD services are running
- ESENT Database Performance – Monitors the AD database engine health
- Active Directory Web Services – Checks ADWS availability for PowerShell cmdlets
- DFSR Replicated Folders – Monitors Distributed File System Replication status
- Replication Status – Tracks inter-DC replication health
- LDAP Status – Monitors LDAP query responsiveness
- Address Book Status – Checks Global Catalog availability
- Directory Service Status – Monitors overall directory service health
- NTDS Performance Counters – Tracks AD database performance metrics
- DNS Performance Counters – Monitors DNS query performance
The example below shows four out of the twelve elements of the Health Monitoring dashboard: