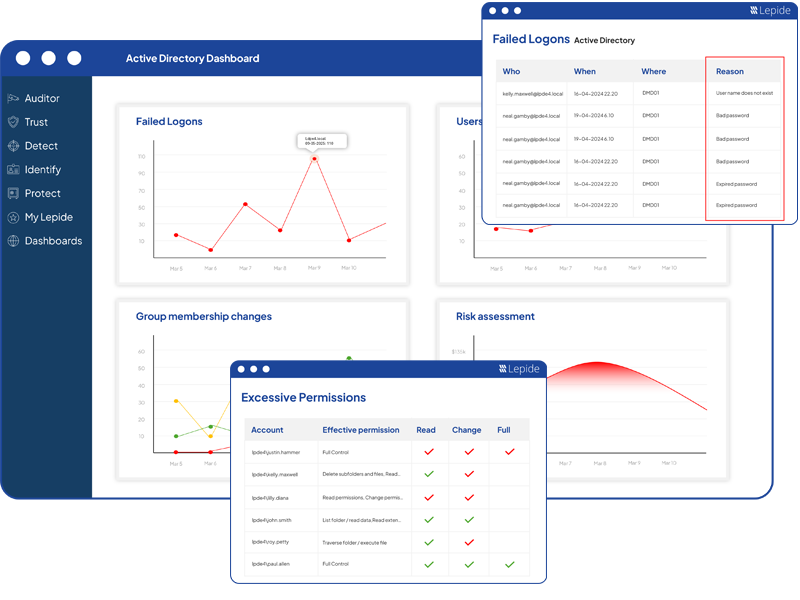
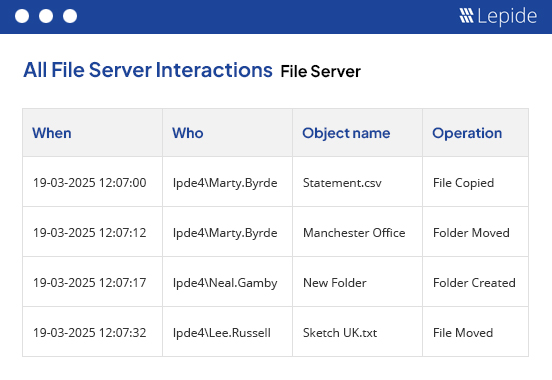
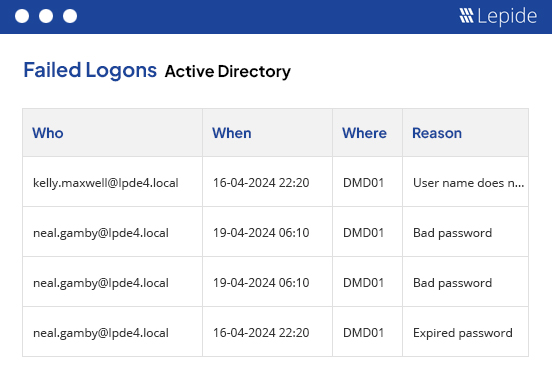
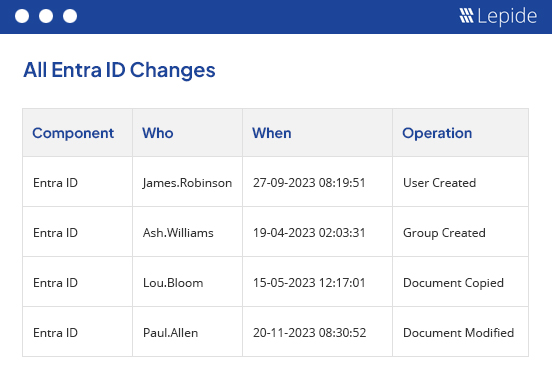
FAQs - Event Log Manager

Event logs generated by computers are a vital source of information to keep organizational network protected from security threats, damages and legal grievances. A specialized tool is required to capture, store and analyze these logs to generate instant alerts and reports on event logs. Native event log management tool suffers from a number of disadvantages which make it risky to rely on them for network security.

Lepide Event Log Manager provides a centralized, intuitive and all inclusive platform to centrally archive, consolidate and monitor Windows and W3C event logs of all computers in the network. It also generates real-time alerts on critical events before any significant damage happens to the computer. Software also offers built-in compliance reports. So, answering audit questions is as easy as selecting the concerned compliance reports in software and clicking on generate button.

Major functionalities of software are:

  • Network-Wide Event Log Archiving to a Central Repository: Lepide Event Log Manager archives network-wide event logs in a central repository and consolidates them for further processing. It sets aside all the intricacies an administrator usually faces while managing event logs in a large organization.
  • Comprehensive Reports on Regulatory Compliance: Lepide Event Log Manager helps the organization to sustain compliance and avoid legal hassles and penalties by providing comprehensive compliance reports for HIPAA, GLBA, PCI, FISMA and SOX. Compliance reports can be generated for the entire network, specific group of computers or a single computer.
  • Comprehensive Monitoring and Real Time Alerts on Critical Events: Lepide Event Log Manager keeps a check on event logs and alerts the administrator for critical events able to affect system health, cause security issues and compliance violation. Software sends an instant email alert on occurrence of events that are pre-specified as critical by the administrator.
  • Simplified Event Browsing and Requirement-Centric Filtering: Lepide Event Log Manager simplifies event browsing for all computers available within the network without requiring the administrator to stop over every computer. Software provides a centralized platform to view all or required Windows and W3C event logs for any computer. It also provides various filter options for requirement-centric and instant event browsing.
  • Lepide Event Log Manager is an economical and feature-rich application to support long-term archiving.
  • It provides an intuitive and cost-effective platform to manage event logs of all computers in the network.
No. You can add as many computers from as many domains and workgroup as you want to manage their events.

Prerequisites:

  • Microsoft .NET Framework 4
  • SQL Server (located anywhere in the network)

Supported Platforms

  • Windows Server 2003 (32/64 bit)
  • Windows Server 2008 (32/64 bit)
  • Windows Server 2008 R2 (32/64 bit)
  • Windows XP (32/64 bit)
  • Windows Vista (32/64 bit)
  • Windows 7 (32/64 bit)

Supported Virtual Environments

  • Microsoft Hyper V
  • VMWare
  • Microsoft Virtual PC

Supported SQL Servers:

  • SQL Server 2000
  • SQL server 2005
  • SQL Server 2005 (Express Edition)
  • SQL Server 2008
  • SQL Server 2008 (Express Edition)
  • SQL Server 2008 R2
  • SQL Server 2012

Minimum System Requirement:

  • 2 GB RAM
  • Disk space as per database size (2 GB minimum)

Lepide Event Log Manager is available in two versions: Free Edition and Enterprise Edition.

Free Edition: Free edition of Lepide Event Log Manager is available to experience its potential and functions for 15 days. However, free edition of software has certain limitations, such as:

  • Maximum 10 computers are allowed.
  • W3C event collection is not available.
  • User can browse events of last 30 days.
  • User cannot save any events.
  • Offline event browsing is not available.
  • Instant reports cannot be scheduled.
  • Instant reports cannot be saved.
  • Scheduled report is not available.
  • Only one Custom report can be created at a time.
  • Max 3 Alerts can be created.
  • Alert can be generated on event id and event source.
  • Events of last 30 days will be collected and events earlier than 30 days will be deleted from database.

Enterprise Edition: Trial version of Enterprise Edition offers complete features without any functionality limitation but there is a time-limit of using it. Contact Lepide at sales@lepide.com to get the license of using Enterprise Edition’s trial version.

You can purchase this software directly from our website. You can also contact our sales team at sales@lepide.com for purchasing this software.

Lepide Event Log Manager collects Windows Event Log and W3C Event Log from entire network and generates Instant Reports, Alerts, and Queries which help in fulfillment of compliance requirements, network security, and sort out system performance issues.

LELM needs to collect and store Windows and W3C event logs from the entire network in its local database before you can start using it.

  • You first need to configure SQL Server database in the application.
  • Create Groups and add network computers in them to collect their logs.
  • Configure Event Collection to decide what all event logs you want to collect and at what interval do you want to collect.
  • Then you can go on to generate Dashboard reports, browse through event logs, generate reports, schedule reports for automatic generation and delivery and create real-time alerts to know instantly about critical events of the network.

Configuring database is the first step for working with Lepide Event Log Manager all other options will remain disable till database configuration. For configuring database you need to follow these steps:

  • Launch Lepide Event Log Manager.
  • Click Configure Database under Settings Tab.
  • Configure Database page will appear. Specify the SQL server Name that will be used to store all the event logs for the computers whose events you want to monitor. You can use Select Server button to get a list of all available SQL servers in the network.
  • Specify Database Name that will store the events related data. You can choose an existing database or specify a new name to create a new database.
  • Select Use Windows Authentication or Use SQL Server Authenticationoption to login to the database.
  • If you click the Use SQL Server Authentication option you will be required to provide user name and password.
  • Click Save Settingsand you will see the connection status at the bottom of the page. Once the connection is established, a message “Database Information Saved” will appear.  
  • You can verify whether the database has been successfully configured or not using Test Database Connection option.

NOTE: If Database connection could not be established then check SQL server connectivity from your system.

If you want to send scheduled reports and instant alerts from the application, you first need to configure an Email server in the application. Follow these steps to configure an email server:

  • Click on Settings Tab.
  • Click on Configure Mail Server option under Settings Options in the left pane.
  • Configure Mail Server page will appear.
  • Enter the Mail Server name, Port number and Sender's E-mail Address. You can also select the option to Send Message Using SSL.
  • If SMTP Mail Server requires authentication, select Requires Authentication option and specify the concerned User Name and Password.
  • Click on Save Settings option to save mail server information. You can click Test Connection option to test the connection with the mail server.

Groups are a logical collection of computers in your network. To create a new group, follow these simple steps:

Click on Settings Tab.

  • Click Manage Groupstab.
  • It shows an already created Group by the name of Default. You can add computers to this Group or can create new Groups. To create new Groups:
  • Click Add Group option under Group Management Task in the left pane.
  • Add New Group dialog box will appear. Specify the Group Name and Group Description.
  • Click on Login Credentials Tab. Specify the login credential that will be used to access all computers in this Group.
  • Next, click on Events Log tab.
  • Select the Event logs that you want to collect for the computers of this Group.
  • To add other types of event logs not displayed in this list, click on Search and Add button that opens up Application and Services Logs window.
  • Select the Logs that you want to add and click onOk.
  • Click on OKand Apply on Add New Group window to complete the process.

NOTE: Once you have created a Group, you need to add Computers to this Group before you can start collecting the logs.

Yes. Manage Groups feature allows you to modify Group and remove Groups from application.

To modify a Group:

  • Go to the Manage Groups tab.
  • Click on the Modify Group option under Group Management Tasks in the bottom-left pane.
  • Modify Group dialog box opens up. Select the Group that you want to modify.
  • Manage Group - (Modify Group) wizard opens up. Make the necessary changes to the Group as per requirement.
  • Click Ok to save the changes.

Yes. You can delete an existing Group. To delete an existing Group:

  • Go to the Manage Groups tab.
  • Click on the Remove Group option under Group Management Tasks in the bottom-left pane.
  • Remove Group dialog box opens up. Select the Group that you want to remove.
  • If you want to move the computer(s) of this Group to Default Group rather than removing them from application, you can use Move the existing Computer(s) to Default Group option.
  • Click onRemovebutton to complete the process.

Once you have created Groups, you can add the computers to these Groups as per requirement. To add computers to the specified group, follow these steps:

  • Select Add New Computer option from the Computer Management Tasks in the left pane.
  • Add New Computers wizard opens up. It has three tabs: General, Login Credentials and Event Logs.
  • Click on the General tab.
  • Select the Group to which you want to add computer(s) from Select Group Name dropdown.
  • For adding computers, there are three options i.e. Add Manually, Add from Network and Add from Active Directory. Select the desired option.

Add Manually:

  • If you select Add Computer Manually, Add Computer(s) Manually dialog box will appear.
  • Here you have two options: Add Computer by Name and Add Computer(s) from .CSV file.
  • To add computers by name, you need to specify the Computer Name or its IP Address.
  • You can also specify the Domain Name or Workgroup name which is optional.
  • If you select Add Computer(s) from .CSV file, you can load multiple files in one go.
  • Correct format for specifying computers’ name in CSV is: (Computer Name),(Domain Name),(IP Address). For example: Comp1,My Domain, 198.10.10.0.
  • And then import that CSV file to the application using Browse button.
  • Click OKto complete the process.

Add From Network:

  • If you select the Add from Network option for adding computers, a new dialog box appears with the list of computers available on the network.
  • Select the desired computer(s) and click Ok.

Add From Active Directory:

  • If you select the Add from Active Directory option for adding computers, Set Active Directory Parameters dialog box appears.
  • You can either choose Use Default Parameters or Custom.
  • Use Default Parameters:Application will automatically select the parameters of the AD to which the host computers belong.
  • Custom: You can specify any other AD's parameter, for this you will have to specify the following parameters: LDAP AD Path, Server IP Address, User Nameand Password.
  • ClickOKafter specifying your choice.
  • List of all computers in the selected AD will appear. Select the computers that you want to add.
  • Click Add button.

Next click on Login Credentials Tab. Specify the Login Credentials for the computers. It has two options, you can choose either of the two:

  • Inherit Login Credentials from Group:Login credentials specified for the Group will be used by the application to access selected computers.
  • Use Different Login Credentials:You can specify a different login credential that will be used for these computers.

Here, you can specify what all event logs you want to gather. You can select Get Event Log Information from Groupto select events logs as specified for the Group to which these computers are being added.

Else, you can select different Event Logs from the list as given below. If you cannot see the Event Log that you want to select in the list, use Search and Addbutton to search for the specific Logs and add to the list.

Finally, click OK to complete the Add Computers process.

After Adding the computers follow the below steps in order to get event logs from that particular computer:

  • Manage Groups -> Select particular Computer ->Right click -> Modify computer -> In new window give the credential for that computer -> Select all/desired type of events that you want to monitor -> Click apply and Ok.
  • Follow the same procedure for all the computers whom you want to monitor. In the event browser you will get all your Event Logs.

Yes. After you have added computers to the group. You can modify its information if required. To modify computer information:

  • Go to the Manage Groups tab.
  • Click on the Modify Computer Information option under Computer Management Tasks in theleft pane. Modify Computer Information dialog box opens up.
  • Go to the Manage Groups tab. Click on the Modify Computer Informationoption under Computer Management Tasks in the left pane.Modify Computer Information dialog box opens up.
  • Expand the tree on the left pane to select the Computer whose information you want to modify.
  • Here, you can modify the Login credential and Event Log collection related information of the Computer.
  • To change the IP Address or Domain name information of the Computer click on advanced tab.

Yes. You can remove computers from Group. To remove computers from a group:

  • Go to the Manage Groups tab. Click on the Delete Computer option under Computer Management Tasks in the left pane.
  • Remove Computer(s) dialog box opens up.
  • Select the Group that contains the computer(s) you intend to remove.
  • Select the Computer(s) from the list of computers in this Group.
  • Click on Delete button.

Yes. You can move computers from Group. To move computers from a group:

  • Go to the Manage Groups tab. Click on the Move Computer option under Computer Management Tasks in the left pane.
  • Move Computer(s) dialog box opens up.
  • Select the Source Group from which you want to move the computer.
  • Select the Computer(s) from the list of computers in this Group which you want to move.
  • Select the Target Group where you want to move the computer.
  • Click on the Move button to complete the process.

Using this feature you can export the Group settings such as what all computers are there in the group, what logs will be collected for the computers of this group and all other settings to the local disk. Later on, you can import these settingsfrom the local disk. In this way you can save labor and time in creating groups in the application.

Application provides an event browsing interface through which you can simply browse through Windows and W3C logs. All event logs are categorized under three heads in this section: Windows Event Logs, Application and Services Logs, and All W3C events.

To view Windows Event Logs:

  • Open Event Browser tab.
  • Select the Group from the Select Group dropdown which contains the computer whose event you want to view.
  • Select the concerned Computer from the Select Computer dropdown.
  • Expand Windows Event Logs node in the Event Log Selection pane.
  • Different categories of logs are displayed separately under different nodes.
  • Expand the concerned node and select the logs which you want to browse.
  • All event logs for the selected computer will be displayed in a list like structure at the right panel.
  • This list contains Computer Name, User Name, Event id, Event Source, Event Type, Event Date and Event Time.
  • To view Event Description click on an event and its description is displayed on the right pane.
  • Once the event detail has been generated you can perform different operations on it such as Sort, Filter, Save, Delete and Refresh.

Note: You can click on Configure Event Browser button to add an existing DB for event browsing.

To view W3C events, you first need to configure the W3C event collection path. To set the event collection path, follow these steps:

To view Windows Event Logs:

  • Select All W3C Events from Event logs menu. Click on Add/Remove W3C Event Collection Path.
    Note: If you are clicking on the All W3C Events for the first time, a pop up message will appear stating that W3C Event Collection Path has not been configured. Click on Ok to continue.
  • Configure W3C Event Collection dialog box appears.
  • Enter a name for this collection in Collection Name text box.
  • Browse the location of the folder where W3C events are collected and click on Addbutton.
  • You can use the Up/Down button to set priorities of event collection amongst available W3C Logs.
  • Select the Log name and click on OK.
  • To view the W3C Event Logs, follow these steps:
    • Click All W3C Events option in Event Log Selection.
    • Click Start Event Collection button on the Event Details header.
    • All W3C events will be displayed with Event Date and Time, Client IP, Server IP, Server Port No, Requested Method and Requested URL.

Yes. You can save theselogs at the desired location by following these simple steps:

  • Click on Event Browser tab and select Windows Event Logs or All W3C Event.
  • Select event logs that you want to save and click Save Selected Event button from the available options.
  • Confirm Event Saving dialog box will appear.
  • Select if you want to save only the selected events or all events available on current page.
  • Click on OK.
  • Save Report dialog box opens up. Browse the location where you want to save the Log file and select log file format in which you want to save selected event logs.
  • You can choose between HTML and PDF.
  • Click on Save and the selected event logs will be saved at the defined location.

Yes. By using available filter options specific Windows events can be viewed. To filter and view specific Windows events, follow these simple steps:

  • Click on Filter Event option (funnel shaped button) at the Event Details header.
  • A dialog box "Filter Windows Events" will appear.
  • Select event types that you want to view from Information, Success, Warning, Failure and Error.
  • Specify filter value for the Event Source textbox.
  • Specify filter value for the Event ID.
  • Specify From and To date for filtering events on the basis of date.
  • Click on OK and all events matching the defined criteria will be displayed.

Yes. By using available filtration option specific W3C events can be viewed. To filter and view specific W3C events, follow these simple steps:

  • Click Event Browsing and select All W3C Event.
  • Click Filter Event Logs button from available options.
  • A dialog box "Filter Events" will appear.
  • To filter on the basis of date, select Filter Using Date Range checkbox and select from and to date.
  • To filter on the basis of Client IP Address, select Where Client IP Address checkbox and specify its value.
  • To filter on the basis of Requested Method, select Requested Method is checkbox and specify its value.
  • To filter on the basis of Requested URL, select Where Requested URL is checkbox and specify its value.
  • Click on Ok and all W3C events matching to the defined criteria will get displayed.

To generate and view Windows event reports you need to follow these simple steps:

  • Click Instant Reports tab. Navigate to the Report List in the left pane.
  • Expand the node next to the category of reports that you want to view.
  • Select the report that you want to generate.
  • Instant Report Generation pane opens up in the right-pane. It has list of all computers which you have added to the application displayed as per Group.
  • Select the Computers for which you want to generate the report in the right pane.
  • Select Show Query in Report option if you want to view the query that has been used to generate the report.
  • Select the date range for which you want to generate the report in Generate Report For field.
  • Click Generate Report button to generate the report.
  • After the report has been generated, name of the report along with general information is displayed in the right-panel.
  • Top section of the report contains Report Overview that displays bar-graph for five event types.
  • Event details are displayed in the tabular format below.

W3C events are generated by a wide range of web servers such as Microsoft IIS, Apache, Sun Java System Web Serverand Lotus Domino. Lepide Event Log Manager can be used to generate and save reports for future references.

To generate and view W3C event reports you need to follow these simple steps:

  • Click on Instant Reports tab.
  • Click on W3C Events Reports under Report List in the left pane.
  • List of all W3C logs available are displayed.
  • Select the Log from which you want to view the W3C Events Reports. You can also select all logs by selecting Select All Logs checkboxes
  • If you want to view query used to generate this report select Show Query in Report checkbox
  • Select the time duration for report generation in Generate Report For dropdown.
  • Click on Generate Report.
  • Report is generated and displayed in the right-pane.
  • On top of the report, general information related to the report which includes generation date and time and report query is displayed.
  • Just below General Information, Report Overview is shown which gives a graphical representation of data in the form of bar graph.
  • Below Report Overview, full report is displayed in a tabular format.

Yes. You can save these reports on the local disk in PDF format to view them outside application. To save the report:

  • After the report has been generated scroll to the top of the page.
  • Click on the save button (floppy icon)on the top-right corner.
  • Save Report wizard opens up. Select the report format and click on Save to save the report.

Lepide Event Log Manager Compliance reports are generated to meet various network compliance standards such as HIPAA, GLBA, SOX and PCI. You can generate report for any of these compliance standards and can view and access it. To view the compliance reports, follow these simple steps:

  • Click on Instant Reports tab.
  • Expand Windows Event Reports. Compliance Reports node is at the last of the list.
  • Expand Compliance reports node. Compliance reports are grouped according to different compliance standards.
  • Select a particular Compliance category, for example FISMA, or expand it further to select a particular report inside it.
  • Select the Computers for which you want to generate the report in Report Generation section.
  • Select Show Query in Report option if you want to view the associated query as well.
  • Select the date range for which you want to generate the report in Generate Report For field.
  • Finally, click on Generate Reportbutton to generate the report.
  • Once the report gets generated you can view it in the right-panel.

Yes. You can create customized report in the application. To create customized reports follow the steps below:

  • On Instant Reports tab, click Create Custom Report under Tasks section in the left pane.
  • Create Instant Report wizard opens up. Specify the Report Name and Report Description.
  • Select Event Log for which you want to create the custom report and click on Next.
  • On the Create Query page that opens up, click Add to open Add Query Field Window.
  • Select the Field, for example Event ID, Event Type etc. If you are adding the first field,
  • Conditional Operator section will remain disabled, however, after you have added the first field,
  • For adding subsequent query fields you need to select the Conditional Operator AND or OR depending on the requirement.
  • Select the Field Operator as per requirement and specify the Field Value in the given field.
  • Repeat the Step 4 to 6 for adding more fields to your query.
  • Finally, click on Finish to complete the Custom report creation process.
  • Newly created report is displayed under Custom Report category in the left panel.
  • To view custom report follow the steps below:
    • On Instant Reports tab, click Custom Report under Report List section in the left pane.
    • Expand it to select the newly created custom report.
    • Select the Computers for which you want to generate the report in the Report Generation panel.
    • Select Show Query in Report option if you want to view the query that has been used to generate the report.
    • Select time period for which you want generate the report in Generate Report For field.
    • Finally click on Generate Report button to generate the report.

Yes. You need to follow below steps to delete an already created report:

  • Click on the Instant Report tab.
  • On Instant Reports tab, click Delete Custom Report under Tasks section in the bottom-left pane.
  • Delete Report(s) dialog box opens up.
  • Select the report(s) that you want to delete from the list and click Delete button.
  • This will delete the concerned report from the list.

You need to execute the following steps to create new scheduled report.

  • Go to Scheduled Reports tab.
  • Click on Create New Scheduled Report under Tasks section.
  • Schedule New Report wizard opens up.
  • Specify the report name and description.
  • Select Event Log and select the period for which you want to generate report in Generate Report For field.
  • Click on Next.
  • Add Query for Report page opens up.
  • Click on Add button and specify relevant values to create a query for your report. For more information on this, refer Question No 19 – creating customized report in the application.
  • Click on Next.
  • Select all the Computers for which you want to generate the report. Click on Next.
  • Specify the schedule type i.e. daily, weekly, monthly etc.
  • Specify the day and time of the week when the report will be generated.
  • Specify the path for creating the report.
  • Application will indicate the total free space and the minimum space required for performing the operation.
  • Click on Next.
  • Next, you need to define the mail server settings. Either you can use default mail server settings as provided in the Settings tab of the application, or you can specify a different mail Server setting. You also need to specify recipient’s email address.
  • Finally click on Finish to complete the process.

Yes. After you have created a scheduled report you can modify it as per requirement. To modify a scheduled report:

  • Click on Schedule Report tab.
  • Click on Modify Report button under Tasks pane in the bottom-left section of the screen.
  • Select the report from the drop-down that you want to modify.
  • Modify Scheduled Report wizard opens up.
  • This wizard is same as the one used for creating a scheduled report.
  • On the first page you can edit 'Select Event Log" and "Generate Report For" information. Make the necessary changes as per requirement and click on Next to move to the next page.
  • Finally click on Finish to complete the modification process.

To delete an existing scheduled report:

  • Go to Scheduled Report tab.
  • Click Delete Report under Tasks section at the bottom-left section of the screen.
  • Select Scheduled Report dialog box will appear to select the required report from the list. Click on Ok.
  • A confirmation message will appear. Click on Yes and the report will be deleted.

Yes. After you have created a schedule report, you can check its delivery status after the scheduled time in the application. To check delivery status:

  • Click on Scheduled Reports tab in the application.
  • Navigate to the Report List section in the top-left section of the screen.
  • Expand the node against E-mail status.
  • To view list of reports which could not be delivered because of any reason, click on Failed Reports category.
  • All the reports under selected category are displayed in the right panel.
  • It displays information such as Report Name, Report Generation Date/ Time, Report File, Sender's Mail Id and Recipient's Mail Id.
  • You can take following actions under this section:
    • Email Report: Select the record from the list and click Email Report button on the E-mail Status bar. This will re-send the report to the specified recipient.
    • View Report: Select the record from the list and click view report button on the E-mail status bar. The selected report will be displayed.
    • Refresh Events: It will refresh the failed report lists.
  • To view list of reports which have been successfully sent, click on Sent Reports.
  • All the reports under selected category are displayed in the right panel.
  • It displays information such as Report Name, Report Generation Date/ Time, Report File, Sender's Mail Id and Recipient's Mail Id. You can take following actions under this section:
    • Email Report: Select the record from the list and click Email Report button on the E-mail Status bar. This will re-send the report to the specified recipient.
    • View Report: Select the record from the list and click view report button on the E-mail status bar. The selected report will be displayed.
    • Refresh Events: It will refresh all the records in the right panel.

Creating a new Alert with Lepide Event Log Manager is quite simple. Alerts can be easily created by following these steps:

  • Go to the Alerts tab.
  • Click Create New Alert under Tasks section on the bottom-left corner of the screen.
  • Create Alert wizard opens up.
  • Enter Alert Name and Alert Description in the given fields. Click on Next.
  • Select Computers page opens up.
  • Select the computers for which you want to generate the report. You can also use Select All Computers checkbox to select all computers at a time.
  • Click on Next.
  • In the next page, select event log for which you want to create the Alert.
  • After that, you need to add Alert Query Fields. Click Add Field button to add query.For more information on this, refer Question No 19 – creating customized report in the application.
  • Click on Next.
  • Here, click on Select Mail Server button.
  • You can choose a new mail server to send the report or use the existing settings of software.
  • Specify the recipient’s E-Mail Id. Click on Next.
  • Next, provide an Alert message that will be sent with the E-mail. Click on Finish to complete the process.
  • Once the Alert has been created you can view it under All Alerts section in the Alerts tab.
  • Go to the alerts tab.
  • Create new alert.
  • Give a name and description for this alert.
  • Select the computer/group from where you want to monitor that particular user logs on.
  • Select the event type (for log on select "security").
  • Click on add field.
  • Select any one of the four field available for that particular event e.g.-If you know the Event id of log on attempt for your windows server put it in field value, you can also select a range of event id by selecting appropriate field operator.
  • Configure the email settings in case not configured earlier.

Yes. After you have created an alert, you can modify it as per requirement. To modify an existing alert:

  • Go to the Alerts tab.
  • Click Modify Alert option under Tasks section in the bottom-left corner of the screen.
  • Alert Selection dialog box opens up.
  • Select the alert that you want to modify and click on Ok.
  • Modify Alert wizard starts.This wizard is same as Create New Alert wizard.
  • Make the necessary changes and click on Next button to proceed to the next window.
  • After you have done necessary modifications, click on Finish to complete the process.

Yes. You can delete an alert if there is no requirement for the same. To delete an existing alert:

  • Click on the Alerts tab.
  • Click on Delete Alert option under Tasks section in the bottom-left corner of the screen.
  • Alert Selection dialog box opens up.
  • Select the alert that you want to delete and click on Ok.
  • A confirmation message will appear that will ask you to confirm if you really want to delete the Alert. Click on Ok and the Alert will be deleted.

Once you have created an Alert, the concerned Alert is generated and mailed to the recipient’s email address. You can view the status of all such Alerts i.e. Sent or Failed E-mails under E-Mail Status in Alert List panel of Alerts tab.

To view status of alerts:

  • Go to Alerts tab.
  • Expand E-mail Status heading under Report List pane.
  • It shows two categories: Failed Alerts and Sent Alerts.
  • Click Failed Alerts category.
  • All the Alerts under selected category are displayed in the right panel. It displays information such as Alert Name, Alert Date and Time, Alert Generated for, Alert Message, Alert Status and Recipient E-Mail Id.
  • You can take following actions under this section:
    • E-Mail Alert: Email the failed alert from this page. Select the record from the list and click E-Mail Alert button on the E-mail Status bar. E-Mail Alert window will open up, specify Mail Server details and click on Ok, the Alert will be sent to the specified recipient.
    • Refresh Records: It will refresh the failed alerts list.
  • To view Sent Alerts, click on Sent Alerts category.
  • All the Alerts under selected category are displayed in the right panel. It displays information such as Alert Name, Alert Date and Time, Alert Generated for, Alert Message, Alert Status and Recipient E-Mail Id.
  • In this list also you can resend the alerts if required by clicking at E-Mail Alert button.

Lepide Event Log Manager allows you to view history of all the events performed by the application. Activity Log tab contains of two panels:

To view status of alerts:

  • Activity Log List: Displays categories of different actions performed by software. All the activities are put under seven different categories.
  • Details of Activities performed by LEM: Displays list of activities performed by software against the category you select in the left pane.

Various software activity categoriesare:

  • Settings: It shows activity logs of all settings that you perform under the Settings tab of software.They are displayed under three categories:
    • Database Settings: Shows details such as Event type, Event source, Event date and time of the database.
    • Mail Server Settings: Shows details of all the changes that you do to the mail server. For example, when was the database configured and its status.
    • Event Collection Settings: All changes that you perform under Event Collection Settings. Changes in collection frequency, time period etc.
  • Group Management: Under this category all software activities related to Group Management are displayed. For Groups, activities are categorized under Add New Group, Modify Group and Delete Group. For Computers, activities have been categorized under Add New Computer, Move Computer, Modify Computer and Delete Computer.
  • Event Collection: All the activities performed while collecting events are shown under this category. Going through it you can see whether the application has failed to collect events from a particular computer. All the data in this section can be categorized under three parts: With Agent, Without Agent and W3C Event Collection.
  • Event Browsing: Event Browser tab of software allows you to view all the Windows and W3C events. Moreover you can sort, filter and save events from this section of software. This category of Activity Log List deals with all the activities that you can perform under Event Browsing tab.
  • Instant Reports: All the activities that you can perform under Instant Reports tab are captured under this category of activity log. All the reports generated and their details such as fields and the computers for which they were generated can also be viewed under this category of log.
  • Schedule Reports: Scheduling feature of reports allow you to send reports through emails to the designated person periodically or once. All activities related to scheduling of mails and their status is covered under this category of activity logs.
  • Alerts: Software activities related to Alerts such as creating, updating and deleting alerts are covered under this section. Status of manually sent Alerts is also covered under this section.

Yes. You can save software activity logs in HTML and PDF format to view them outside application.You can perform the following operations in this section:

  • Sort Database Events: Sort activity logs events in ascending or descending order on the basis of any column.
  • Filter Events: Filter activity logs events on the basis of specified criteria.
  • Save Selected Events: Save selected events in HTML or PDF format at the specified location.
  • Delete Selected Events: Delete the selected or all activity logs from the application's database.
  • Refresh Events: Refresh the details of activities performed by Lepide Event Log Manager.

LEM collects Windows event logs by deploying agents on target computers or without using any agent. Indicate your choice by selecting “Without Agent” or “With Agent” option. If you select With Agent option, you need to specify whether you want to use Standard Agent or Advanced Agent.

When user want to monitor any remote computer’s Event Logs & remote computer is using firewall or some permission restrictions in that case we install an agent to the remote computer it’s a small .exe file which create a bypass route and establish proper communication between local and remote computer

  • Standard Agent: Up to windows server version 2003
  • Advanced Agent: For windows server 2008r2 and further upgraded version (Recommended)

Note: Using Advanced Agent option requires .Net Framework 4.0 on the remote computer(s)

Lepide Event Log Manager is available in two versions: Freeware edition and Enterprise edition.

Freeware edition: Freeware edition of Lepide Event Log Manager is available to experience its potential and functions for free. However, free version of software has certain limitations, such as:

  • Maximum 10 computers are allowed.
  • W3C event collection is not available.
  • User can browse events of last 30 days.
  • User cannot save any events.
  • Offline event browsing is not available.
  • Instant reports cannot be scheduled.
  • Instant reports cannot be saved.
  • Scheduled report is not available.
  • Max 3 Alerts can be created.
  • Alert can be generated on event id and event source.
  • Events of last 30 days will be collected and events earlier than 30 days will be deleted from database.

Enterprise edition: Trial Version of Enterprise edition offers complete features without any functionality limitation but there is a time-limit of 30 days for trial version.

Refer the link to see the comparison between Freeware and Enterprise Editions: https://www.lepide.com/event-log-manager/download.html

To evaluate its full features you need to activate it with trial activation. To get a trail activation

  • You need to send us license request file (.out file) which can be generated from
  • Help -> License Management -> Upgrade license -> Select request for License key file -> Enter number of computers you need to monitor-> OK
  • An .out file will be created on your desktop send that file to sales@lepide.com to get the trial activation

See the role of license request file (.out) from here.

The licensing of Lepide Event Log Manager based on number of machine/server you want to monitor. We do not differentiate between servers & work stations.